In today’s distributed systems landscape, observability is crucial for understanding and debugging complex applications. Today, I’m excited to share details about otel-worker. Think of it as an OpenTelemetry collector, but without the YAML complexity and heavy infrastructure.
We built otel-worker after encountering some persistent latency with Cloudflare’s D1, where the real bottleneck was elusive. We wanted a straightforward, powerful way to capture, store, and analyze our production traces.
There are existing OpenTelemetry observability solutions including Datadog (if you enjoy throwing money at problems), Baselime, and open source projects, but we decided to roll our own, written in Rust and specifically geared towards Cloudflare Workers. This has some key benefits:
- Traditional OpenTelemetry collectors require significant infrastructure
- Why process telemetry in
us-east-1when you can can store them directly at the edge with Cloudflare’s D1 (we know; Cloudflare has not yet implemented read replicas for D1 yet) - No YAML
We chose Rust as it’s a team-favorite tool inside of Fiberplane and we like writing sharp tools in it, such as our TUI log tailing CLI, Fogwatch.
Alongside Rust, we use the Axum crate for our API. The code is split into
several crates: otel-worker and otel-worker-core. The otel-worker-core
crate contains all the shared code that is used by both the otel-worker
crate and our otel-worker-cli application. The otel-worker crate contains all
the specifics for running our OTLP ingestion code on Cloudflare.
This includes: the workers-rs code, a Store implementation that targets
Cloudflare’s D1 database, and a WebSocket implementation that leverages
Durable Objects for maintaining persistent connections.
The otel-worker-cli is our Swiss Army knife for interacting with the
otel-worker system, whether you’re developing locally or managing a
production deployment. At its core, it provides a local development server
that mimics the Cloudflare Worker environment, allowing you to test your
OpenTelemetry setup without deploying to the cloud. But where it really shines
is in its comprehensive set of management commands. Need to inspect your traces?
The CLI lets you list all traces or dive deep into specific spans with simple
commands like cargo cli client traces list or cargo cli client spans get <trace-id> <span-id>.
For cleanup operations, you can delete individual spans or entire traces just as
easily. The CLI also includes handy system management commands for tasks like database
cleanup, and for the debugging enthusiasts, there’s a hidden WebSocket monitoring tool
that lets you watch real-time trace updates as they flow through the system.
Getting started
The otel-worker implements the OTLP/HTTP spec
and supports both JSON and Protocol Buffers encoding (gRPC is not supported).
It includes HTTP endpoints to retrieve traces and a web-socket endpoint for realtime
notifications about new traces.
Authentication
The otel-worker uses simple bearer token authentication, which is required
for both the OTLP/HTTP endpoints and the traces endpoints.
You’ll configure this token using an environment variable during setup.
Local Development Setup
To get started with local development, you’ll need:
- Rust installed
- The Wrangler CLI installed
Once you’ve cloned the repository, create a new D1 database and apply the migrations:
npx wrangler d1 create fiberplane-otel-db
npx wrangler d1 migrations apply fiberplane-otel-db
Then update your wrangler.toml to include the database configuration:
database_name = "fiberplane-otel-db"
# change the databse_id to whatever was output by the wrangler d1 create command
database_id = "id-of-fiberplane-otel-db"
Next, set up your authentication token (because security isn’t optional) by copying .dev.vars.example to .dev.vars and setting your desired token:
AUTH_TOKEN="your-secret-token-here"Note: Compiling the Worker is not supported on Windows at the moment without WSL.
Finally, start the development server:
npx wrangler devYour local server will be running at http://localhost:8787. Send it some traces:
The worker accepts traces via OTLP/HTTP. The endpoint to send traces to is
/v1/traces.
Here’s an example of how to send traces to the worker using curl from within
the examples/send-trace directory inside the repository:
curl -X POST http://localhost:8787/v1/traces \
  -H "Authorization: Bearer your-secret-token-here" \
  -H "Content-Type: application/json" \
  --data-binary @trace.json
We can now retrieve the traces from the D1 database as follows:
curl http://localhost:8787/v1/traces \
  -H "Authorization: Bearer your-secret-token-here"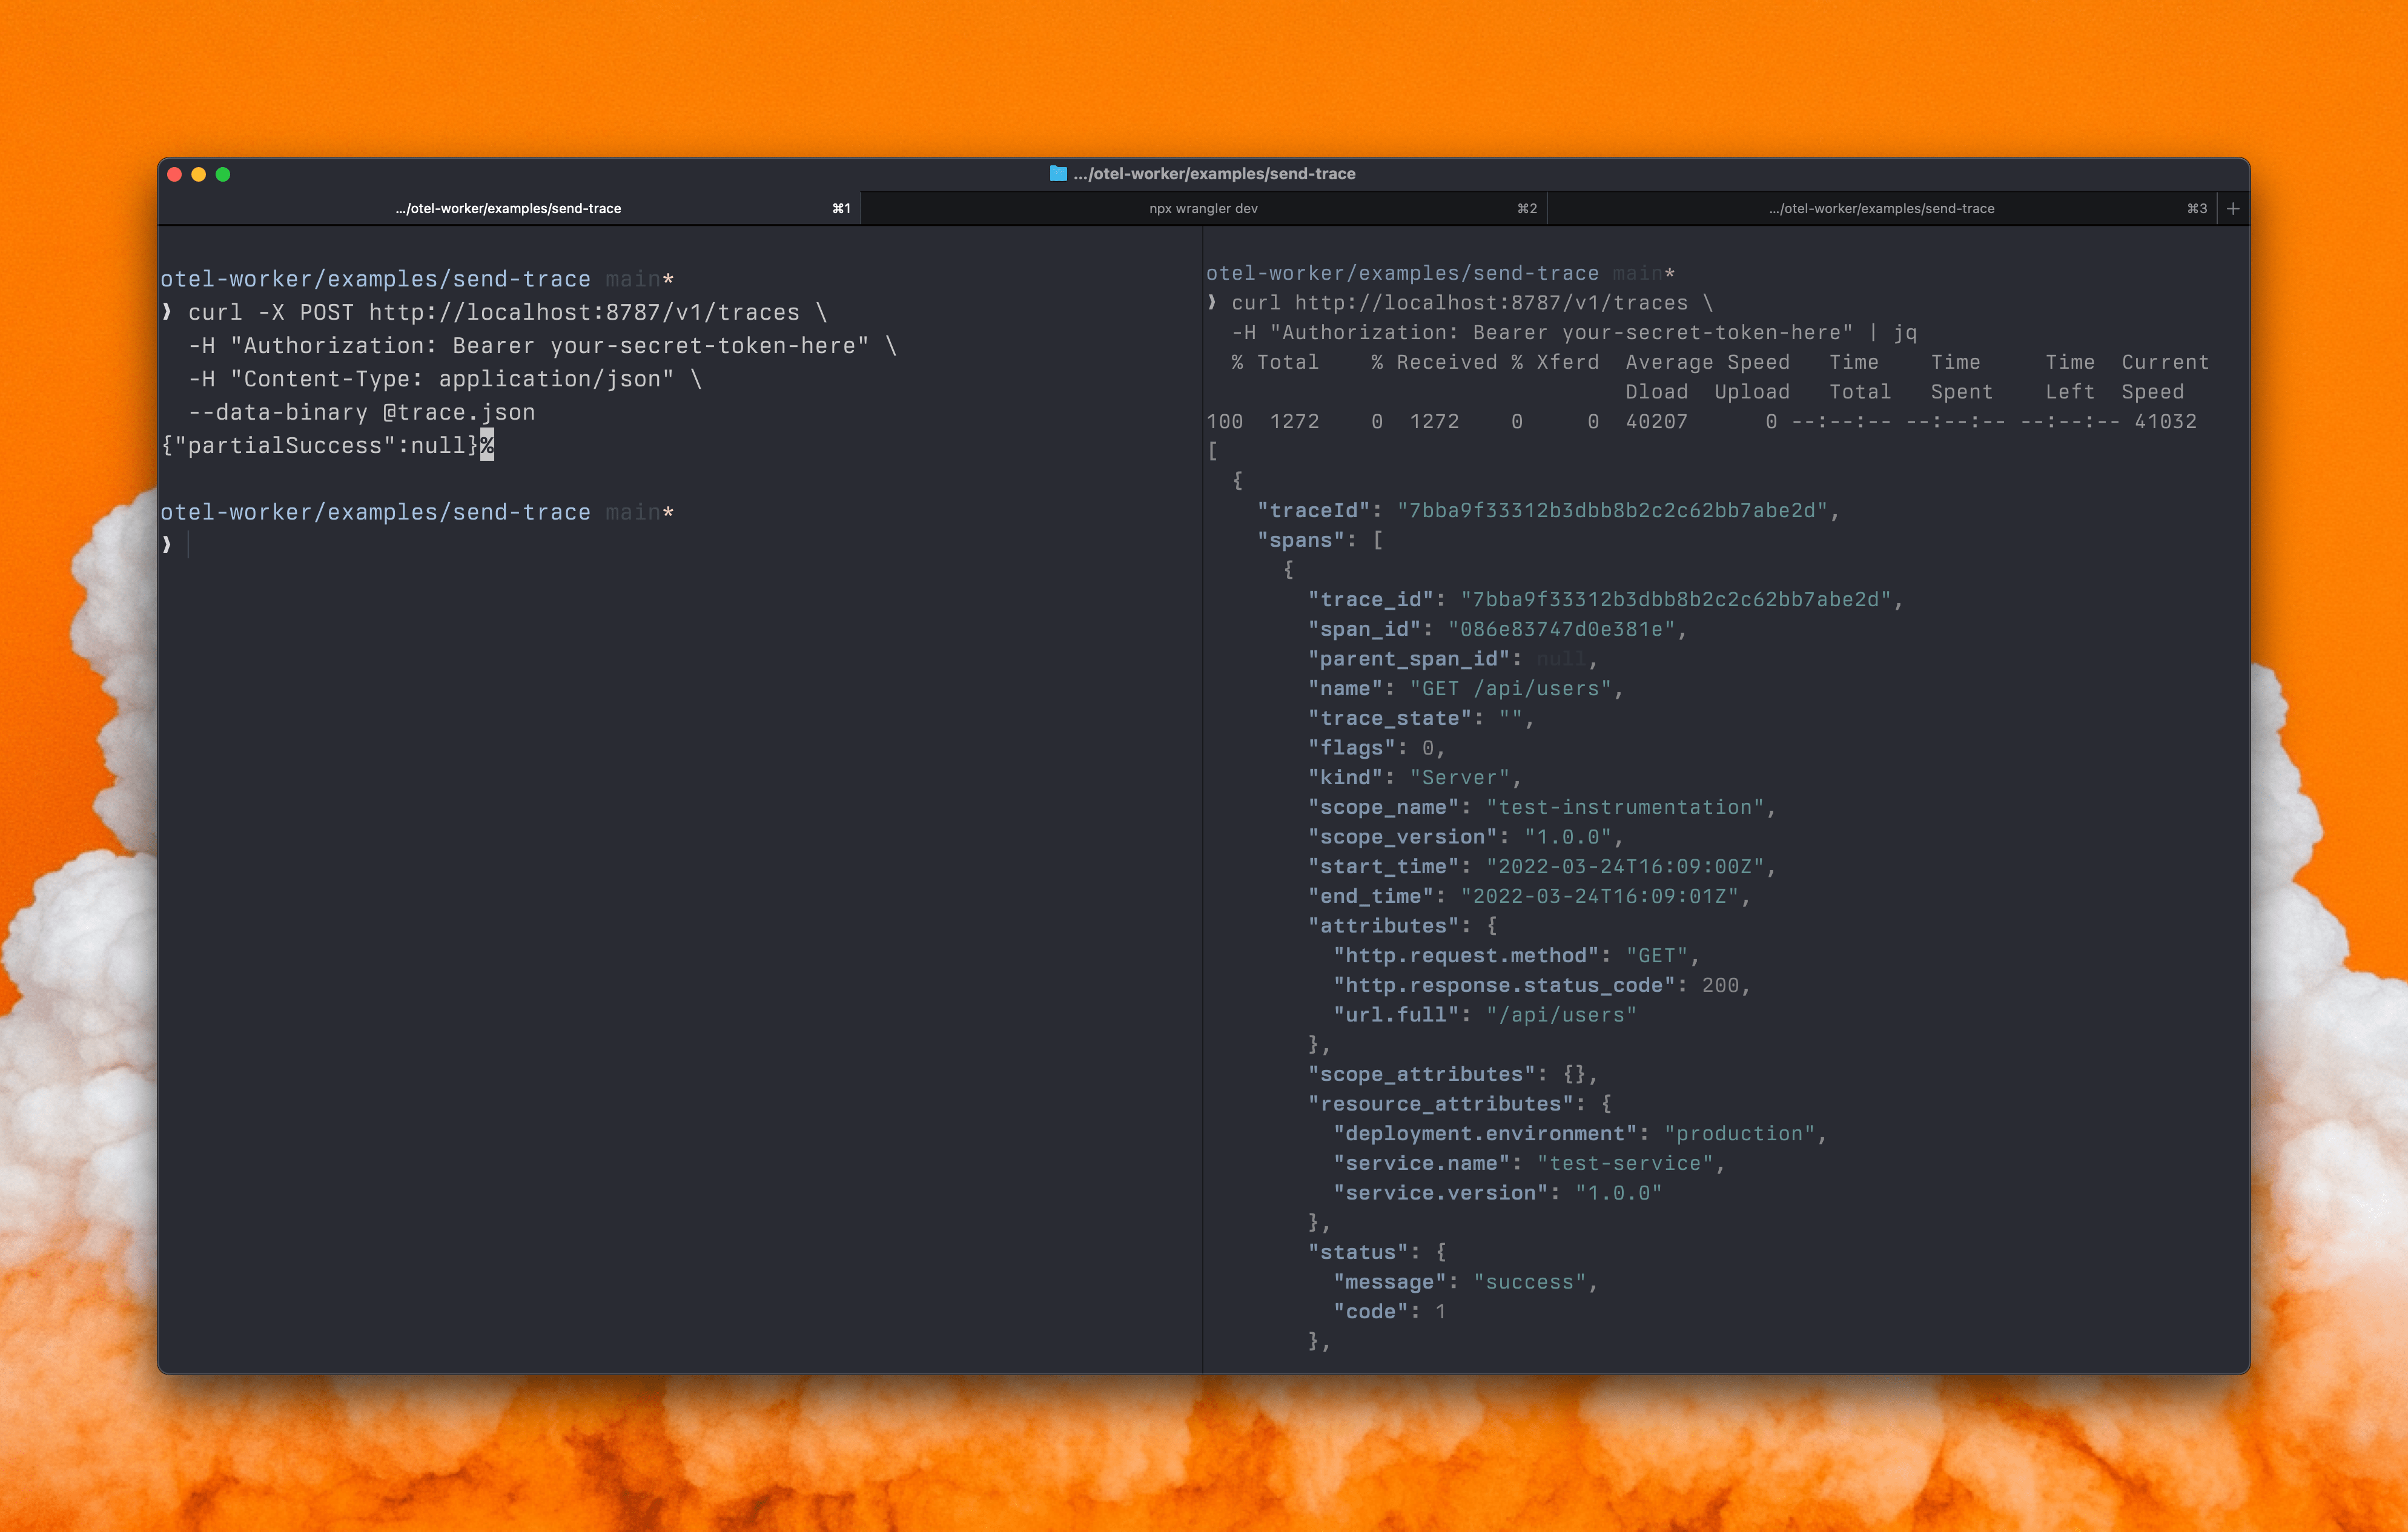
Congratulations! You’ve got a streamlined OpenTelemetry collector up and running—no need to wrestle with a mile-long YAML file this time.
Conclusion
We’re well aware that Cloudflare is going to launch an official OpenTelemetry solution complete with dashboards and alerting. When that day comes, it’ll likely be a great option for many. Until then, otel-worker provides a streamlined, cost-effective alternative—letting you capture and explore your spans without piling on the usual collector overhead. If you’re looking for an easy, no-fuss way to store and analyze traces on Cloudflare Workers, we think otel-worker fills that gap nicely.
The source code for otel-worker is available on GitHub.