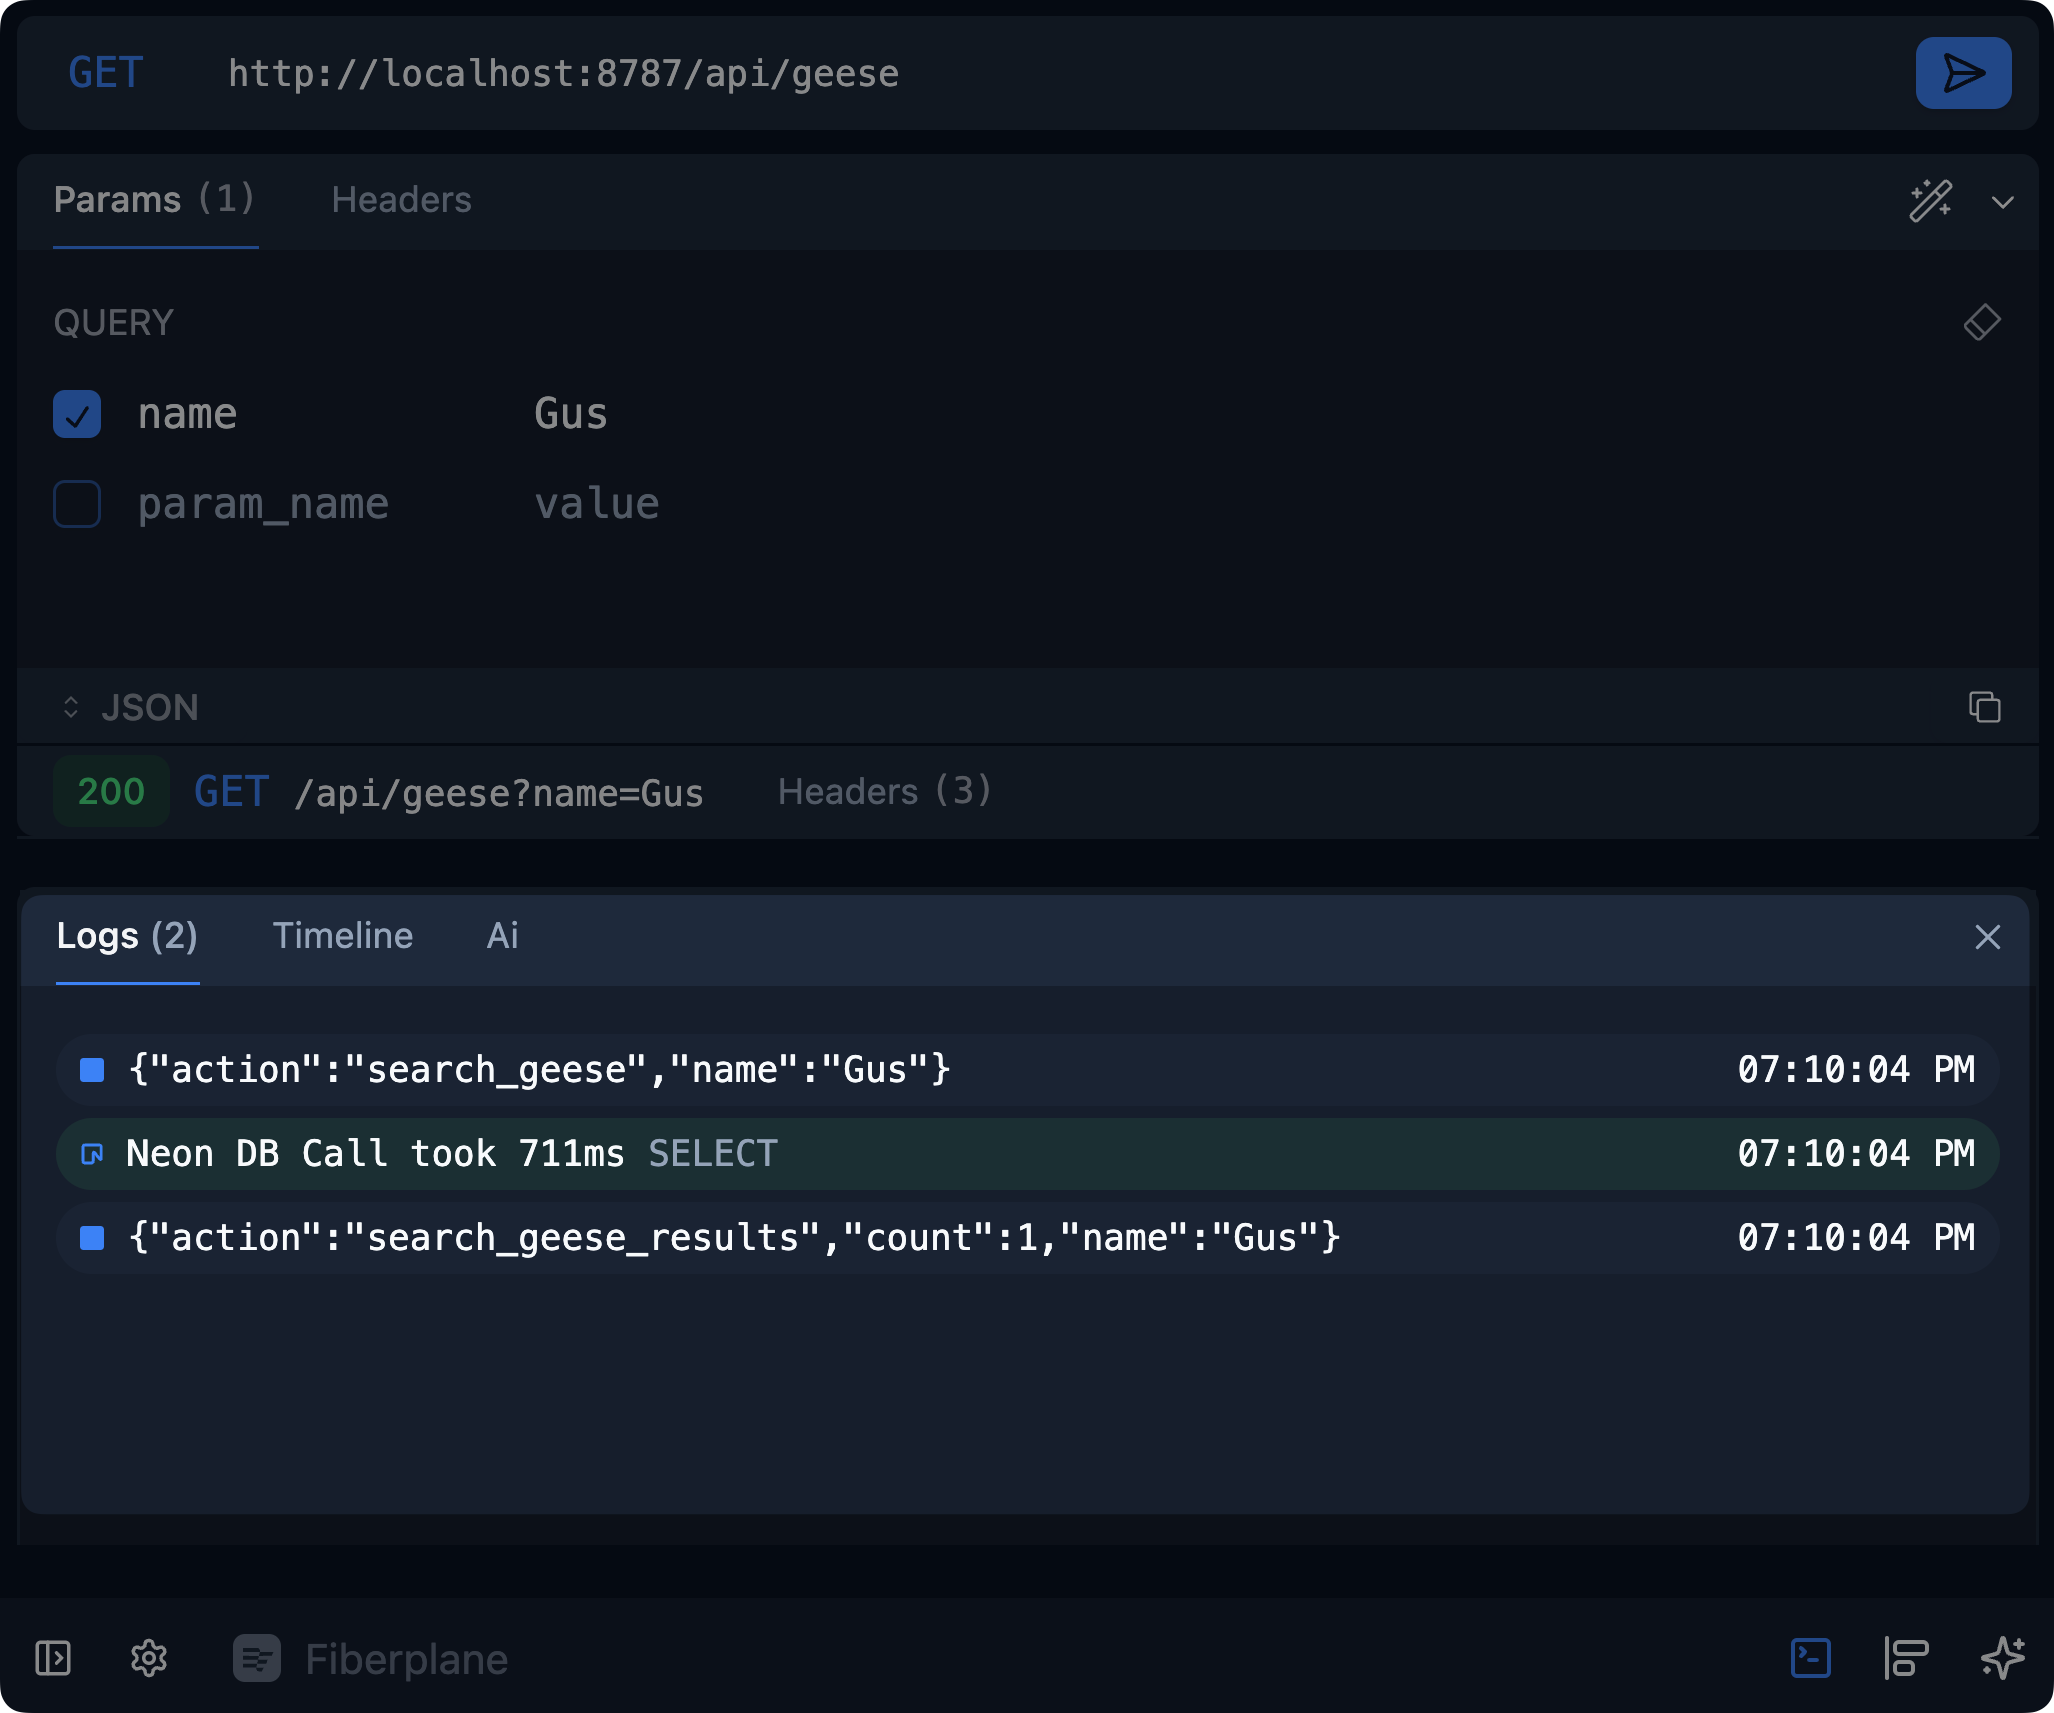
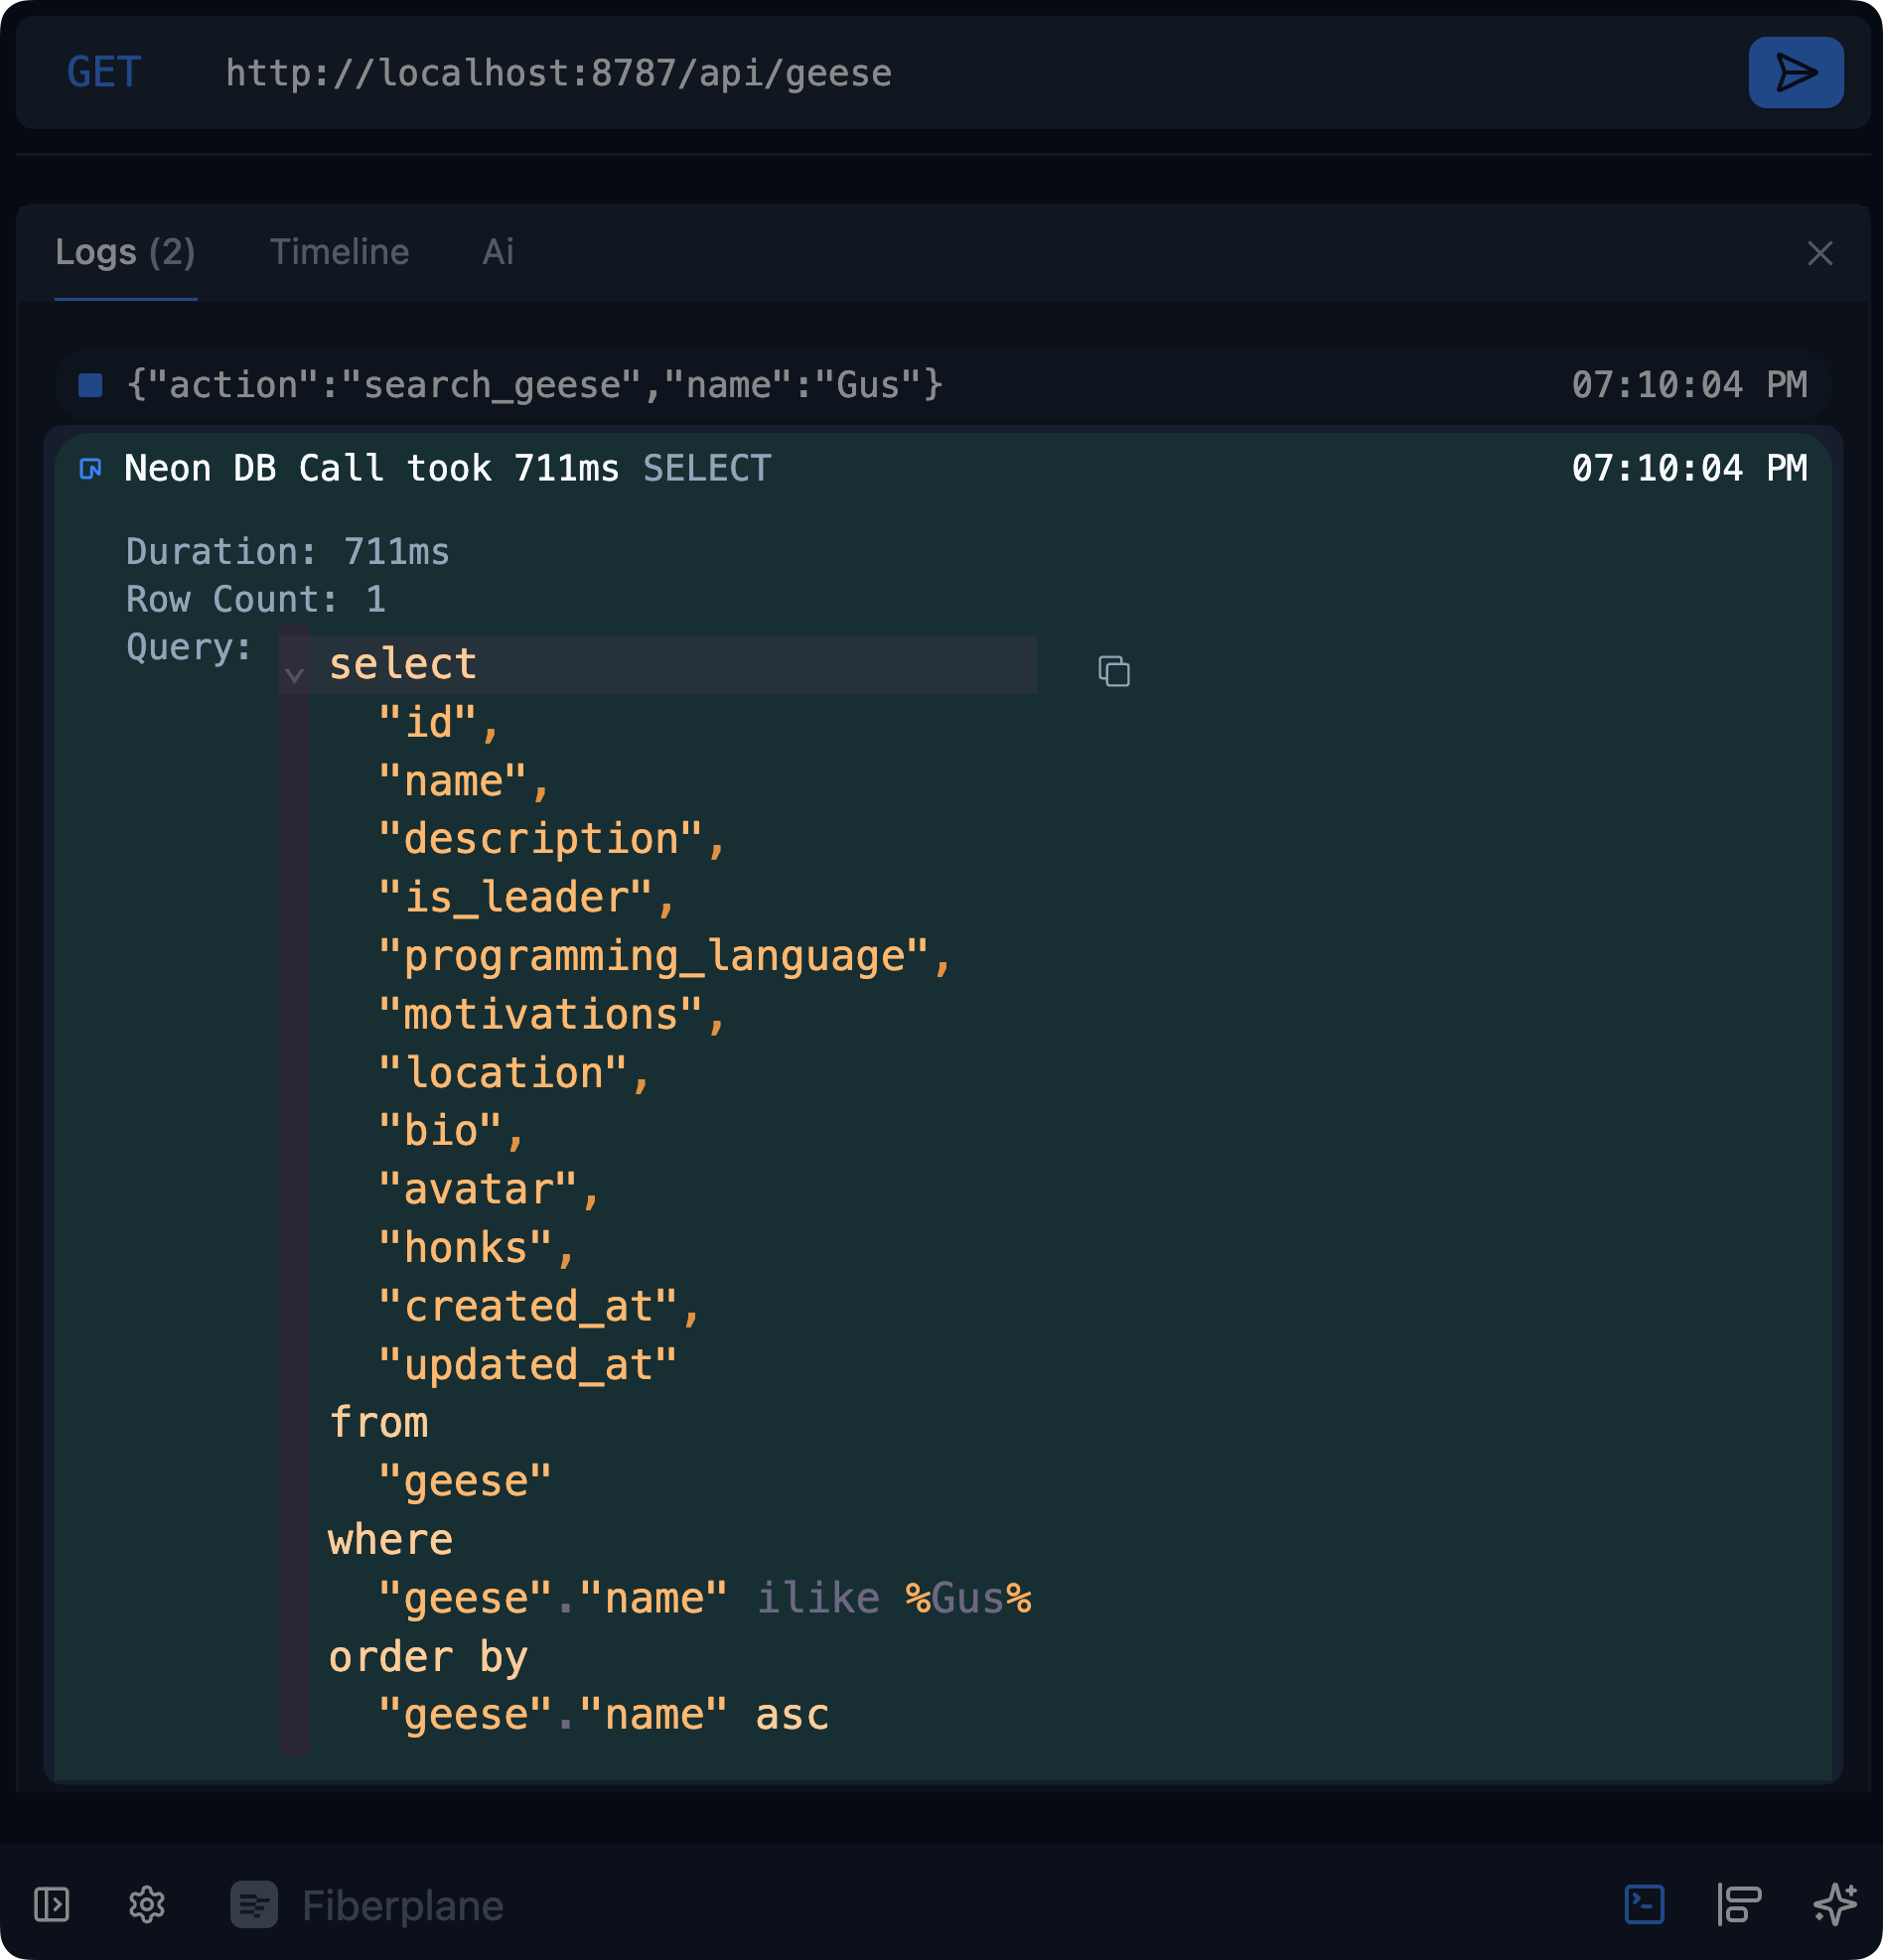
We’re shipping a small but mighty feature in Fiberplane Studio that will allow you to view query logs from Neon directly in the Studio logs table.

TL;DR
You know how the browser console gives you a heads up when a network request errored, or a resource failed to load?
I like that pattern. It gives you context of what’s going on in your app, right alongside any info you chose to print.
Well, in that vein, we’re shipping an enhancement in Studio that will put metadata about Neon queries right in the logs table.
When you click on a Neon entry in the logs table, you’ll see an expanded view with the SQL query that was executed, the duration, and the row count. If there was an error, you’ll see that too.

No configuration necessary—if you’re running Neon in a Hono app, you get some extra info without any work on your part.
This is only the beginning
The logs table in Studio is getting richer by the day.
With plans to also hook into Drizzle’s query logs, Fiberplane Studio will be able to render useful query logs for any database that Drizzle ORM supports.
Are there any other items you think deserve to be rendered in the logs table? Let us know on Discord or GitHub!
Take it for a spin
This new feature is well-suited for 🪿 HONC apps.
If you want to give it ago, spin up a new Hono app with a Neon database using the create-honc-app CLI, and try it out!
bun create honc-app@latestnpm create honc-app@latestyarn create honc-app@latest🪿 Honc! Honc!