Prometheus is a powerful open source observability tool. But many people, myself included, have a hard time wrapping their heads around the query language. In this post, I’ll build up a basic query from scratch while using each step to explain some of the harder-to-understand aspects of PromQL. Hopefully, this provides a little more intuition around how Prometheus works and will help you crafting queries and making sense of your data.
A quick plug for the Autometrics project: it’s an open source micro-framework that makes it trivial to instrument your code with the most useful metrics and it writes Prometheus queries for you. Identify and debug issues in production without needing to write queries by hand!
Answering a question with a “simple” query
Let’s say we’re running an HTTP API and we want to understand how often our users are seeing errors. Seems like a straightforward question, right?
To get this answer out of Prometheus, we’ll need a query along these lines, which already has a fair amount going on:
sum by (status) (rate(http_requests_total[5m]))In order to understand why this query works – and why it’s the query we want – we’ll need to dig into how Prometheus stores data and a few key PromQL features. In the next few sections, we’ll build up this query from scratch while taking the time to understand what each piece is doing and why it’s necessary.
Counters mostly go up
One of the most important and confusing aspects of Prometheus is that most of the values it tracks just go up. Prometheus does not store how many events happened in each little time period. Instead, it keeps track of the cumulative total over time. This is simultaneously the source of a lot of Prometheus’ efficiency and a major source of confusion when it comes to writing queries.
When you create a counter inside your application, it will track the total number of times the thing has happened using a simple number stored in memory. Prometheus scrapes that data every few seconds and stores the totals it has observed. If you want to figure out how many times the event has happened in a specific period of time, you need to write a query to extract that information from the cumulative total Prometheus is actually storing (and we’ll go into that below).
To illustrate this and subsequent points, it’s useful to have a mental model of what the data looks like inside Prometheus. Here’s a simplified picture showing a counter tracking the total number of HTTP requests to a service. Notice how the value of each counter either increases or stays the same across time periods.
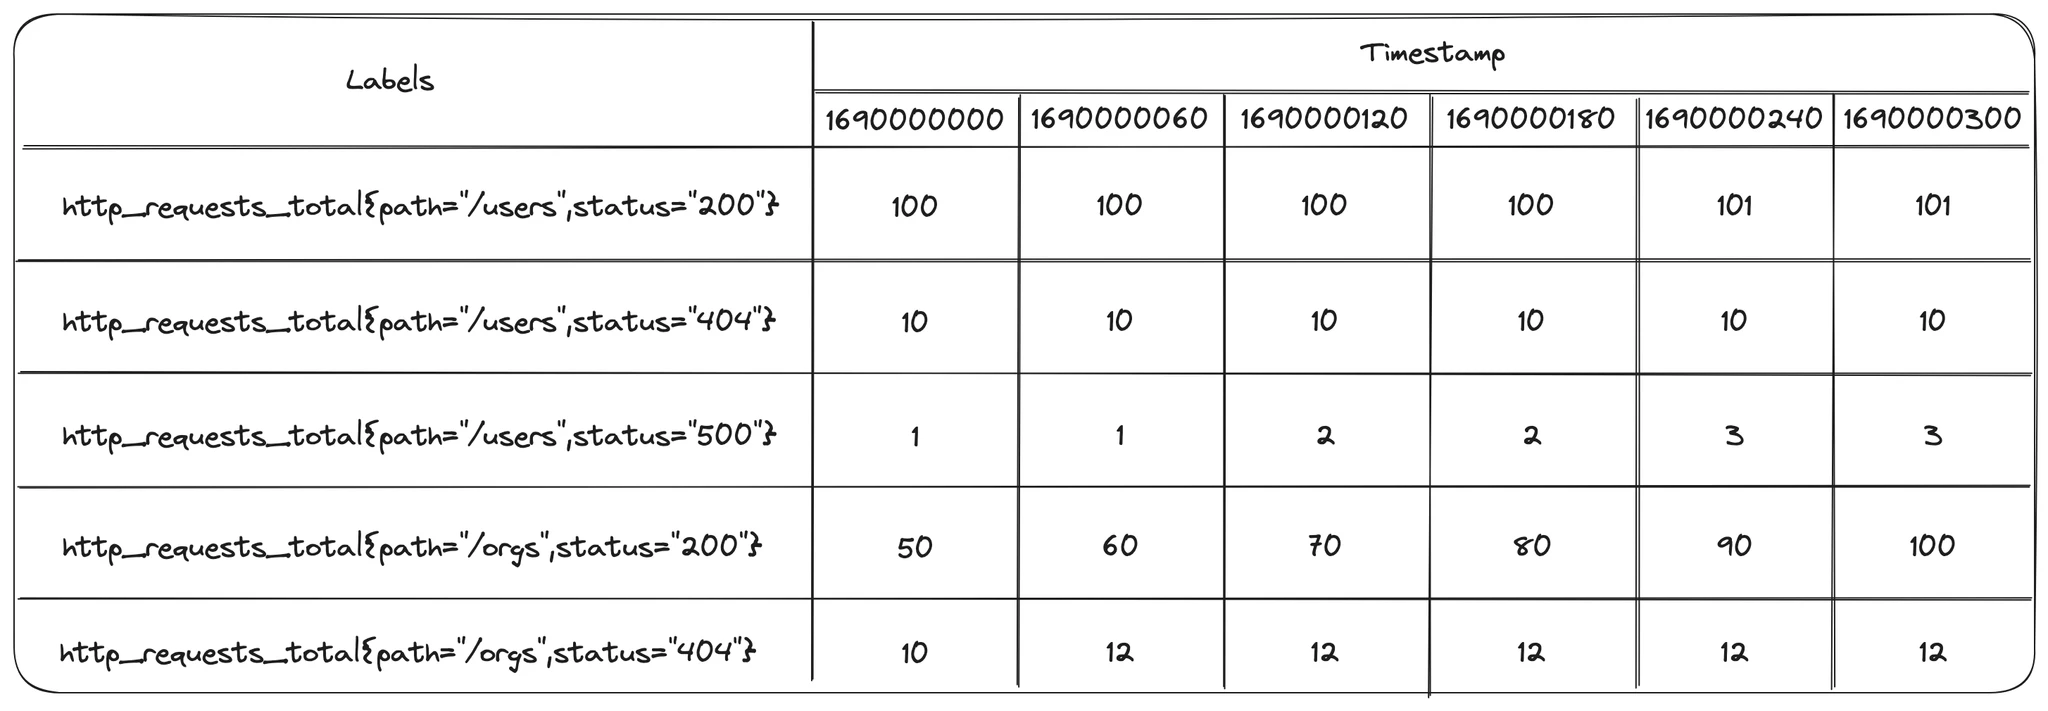
At each point in time, we see the total number of HTTP requests to that service since the beginning, rather than the number of requests since the last observation.
Why do we say counters mostly go up, rather than always go up? Restarts and crashes. If your service restarts for any reason, the value of the counter it was storing in memory will be reset to zero and it will start the count over. PromQL has special functions that handle counter resets automatically so your derived statistics are correct.
Now that we know counters mostly go up, we can get into querying the data to make use of it.
Instants and ranges, oh my!
PromQL has two main types of data: instant and range vectors – and both of these terms immediately make my eyes glaze over.
Here is an illustration of the difference between an instant vector and a range vector. The instant vector, displayed in orange, is a snapshot of the values at a single point in time. The range vector, displayed in blue, has a value for each point in time for each series.
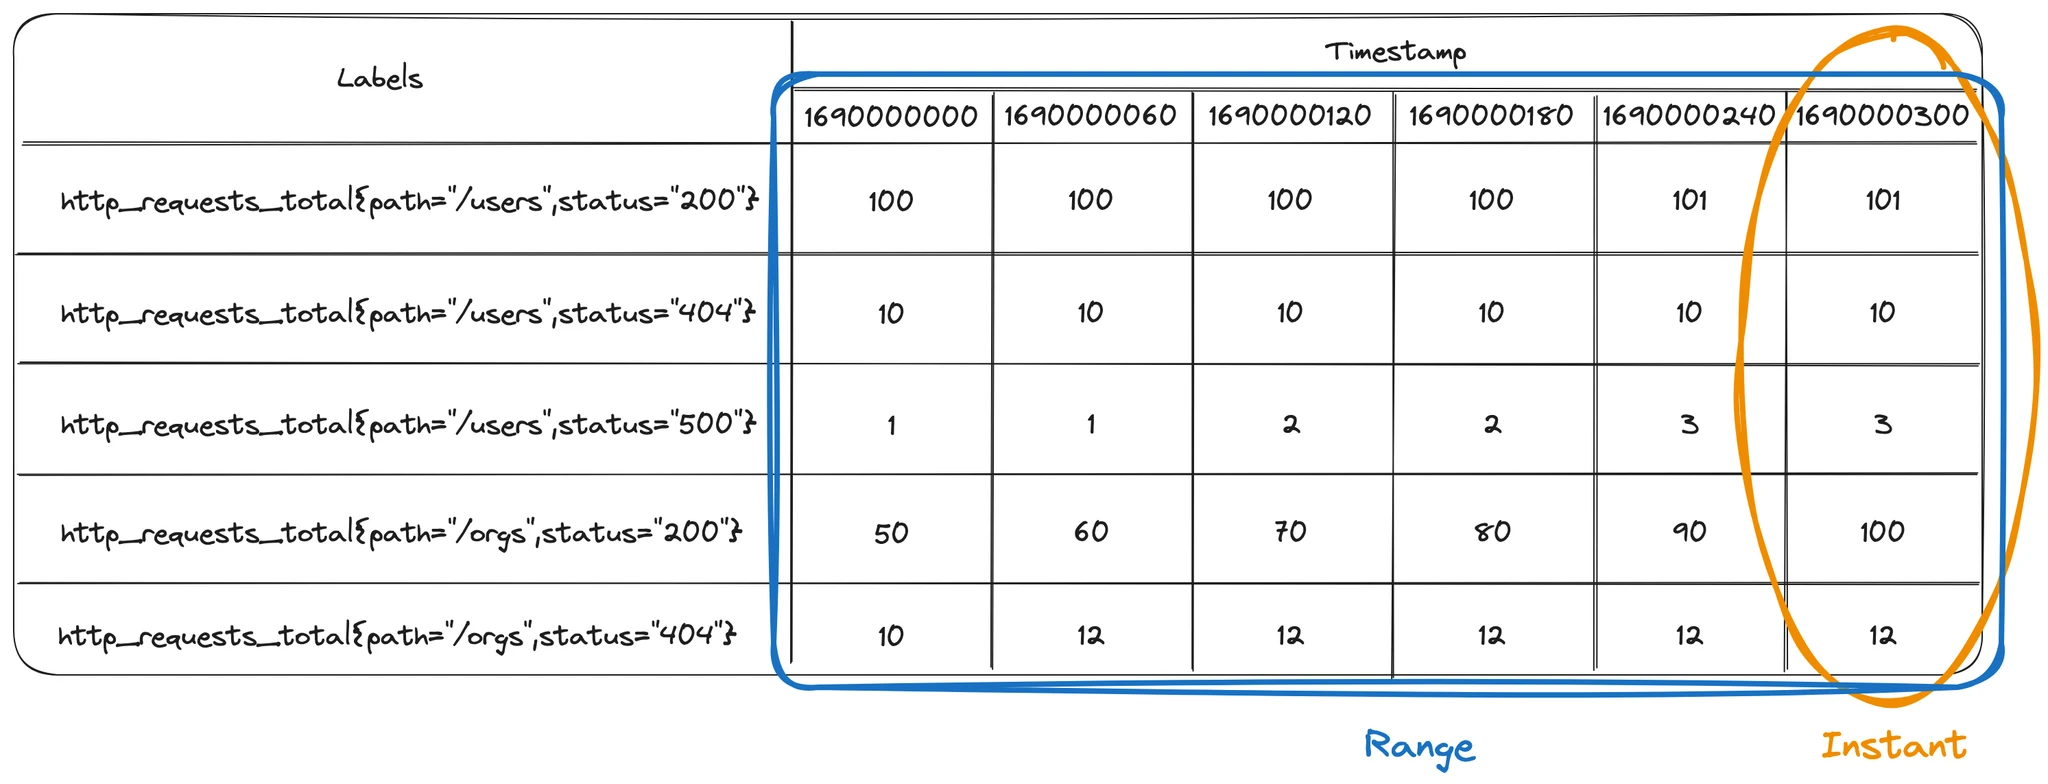
Why do we have two types of vectors? If you want to graph something, you need an instant vector, because a graph can only show one value per series per point in time. However, you rarely want to graph the cumulative total of events over time. Instead, you more often want to graph the rate of change of events over time, and to do this you need to apply a statistical function to a range of data to compute the value to show at each point in time. This is what range vectors are for.
Let’s take a look at how we can start building up a query, which also shows how subtle differences in a query can change whether we’re working with an instant or range vector.
If we just sent the following query into Prometheus, we would get the instant vector that follows. Notice that it is just the last column of data from our table above.
http_requests_total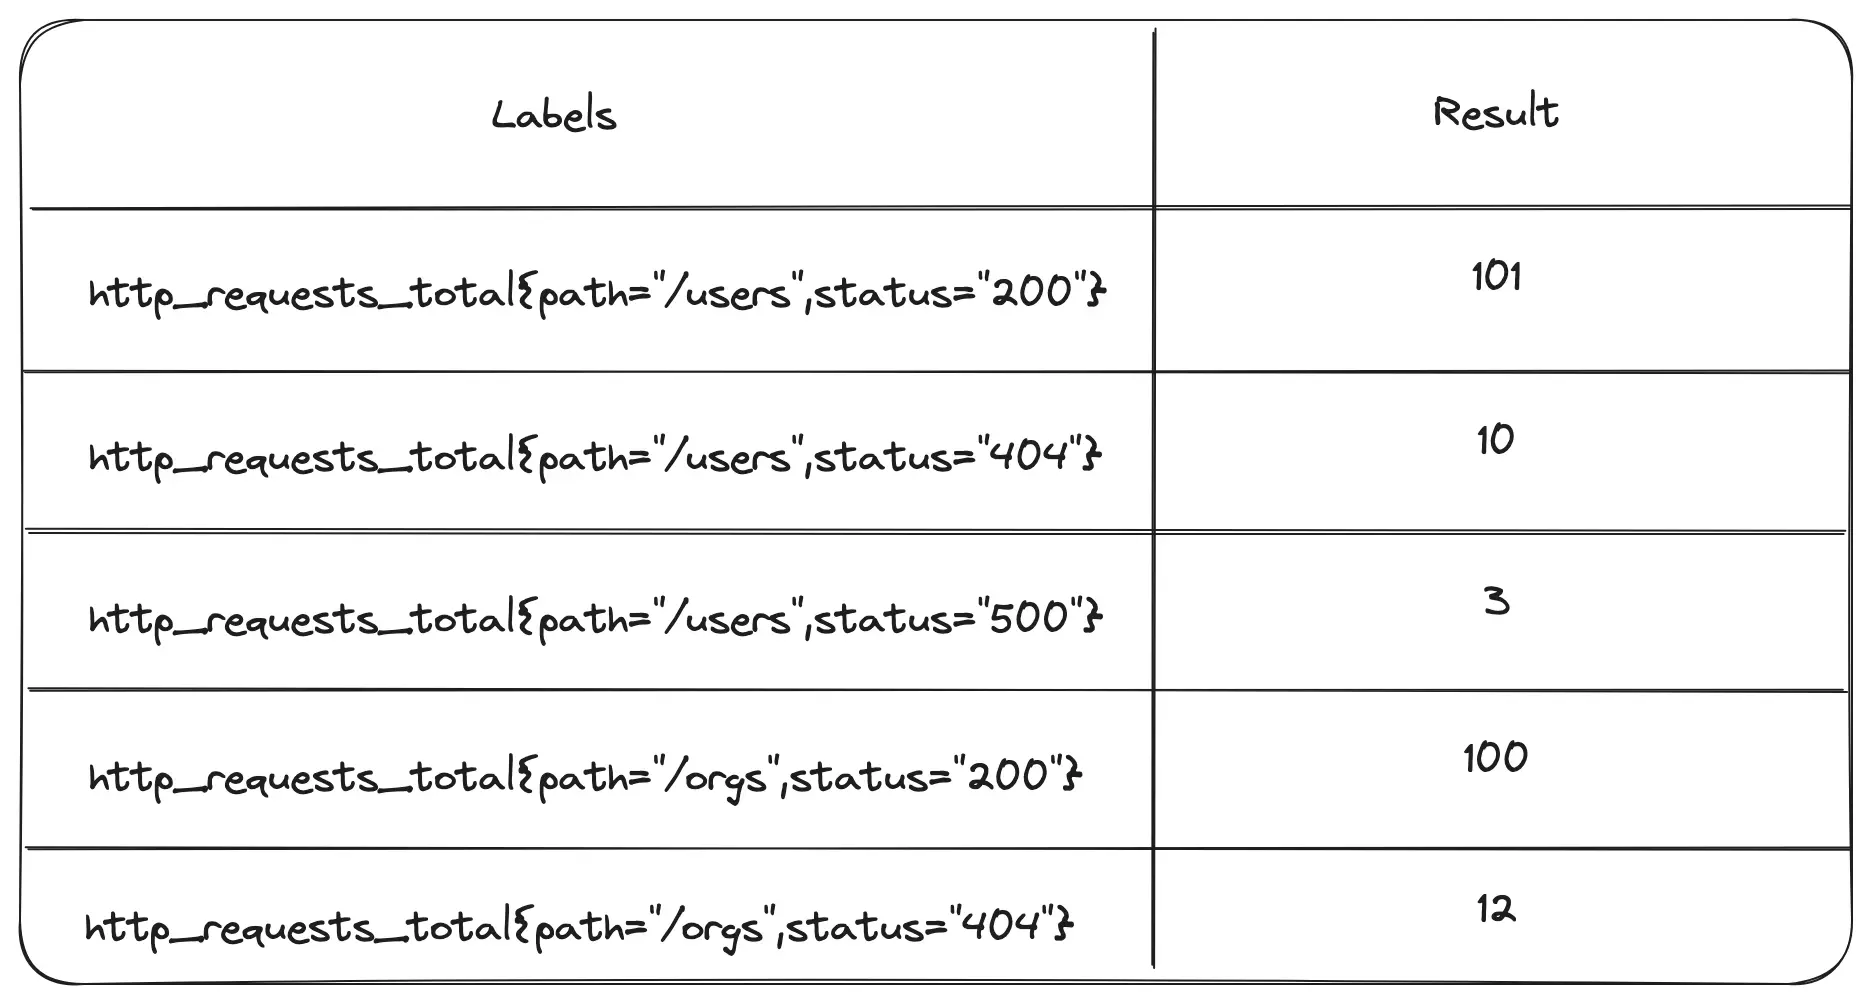
This query returns a range vector that shows the last 5 minutes of data for each series:
http_requests_total[5m]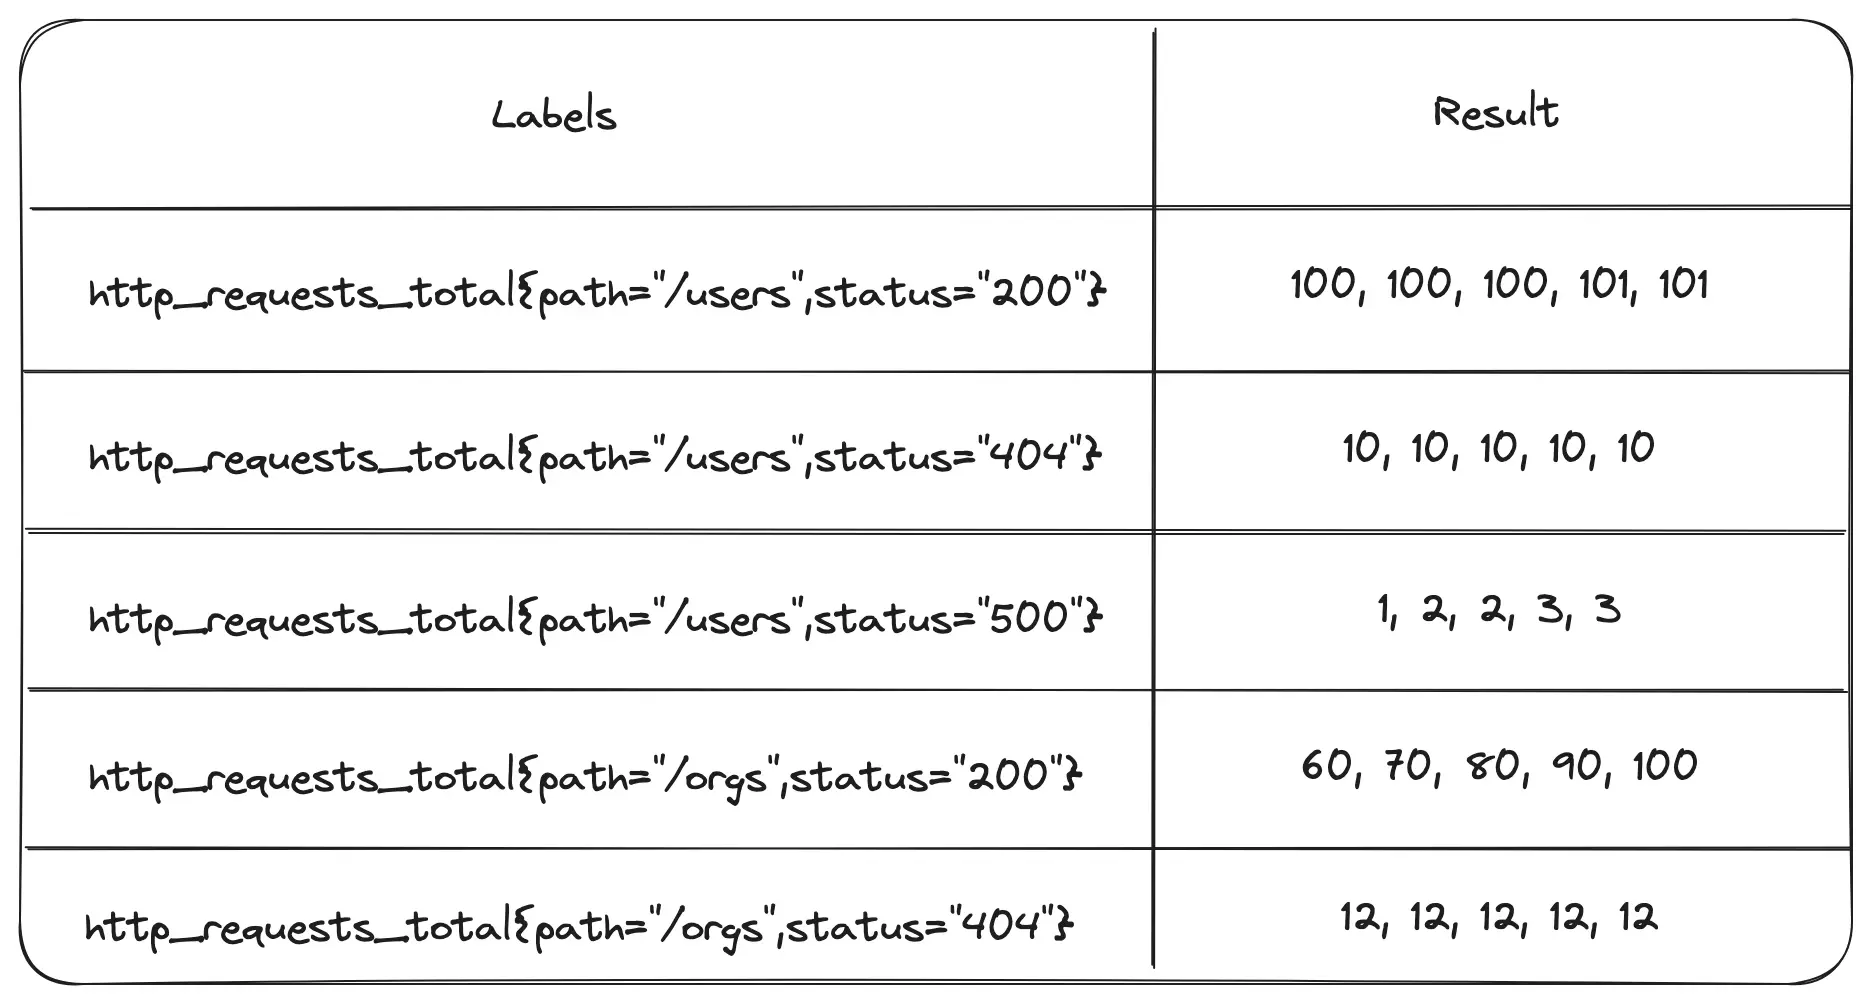
What good is this data? That brings us to our next topic.
Why you’ll often need rate
We mentioned before that counters track the cumulative total over time, but we often want to see a graph showing how many events happened at a particular point in time. This is where the rate comes in.
The rate function shows the average number of events per second calculated over a certain time range. The “certain time range” is where range vectors also come in.
rate(http_requests_total[5m])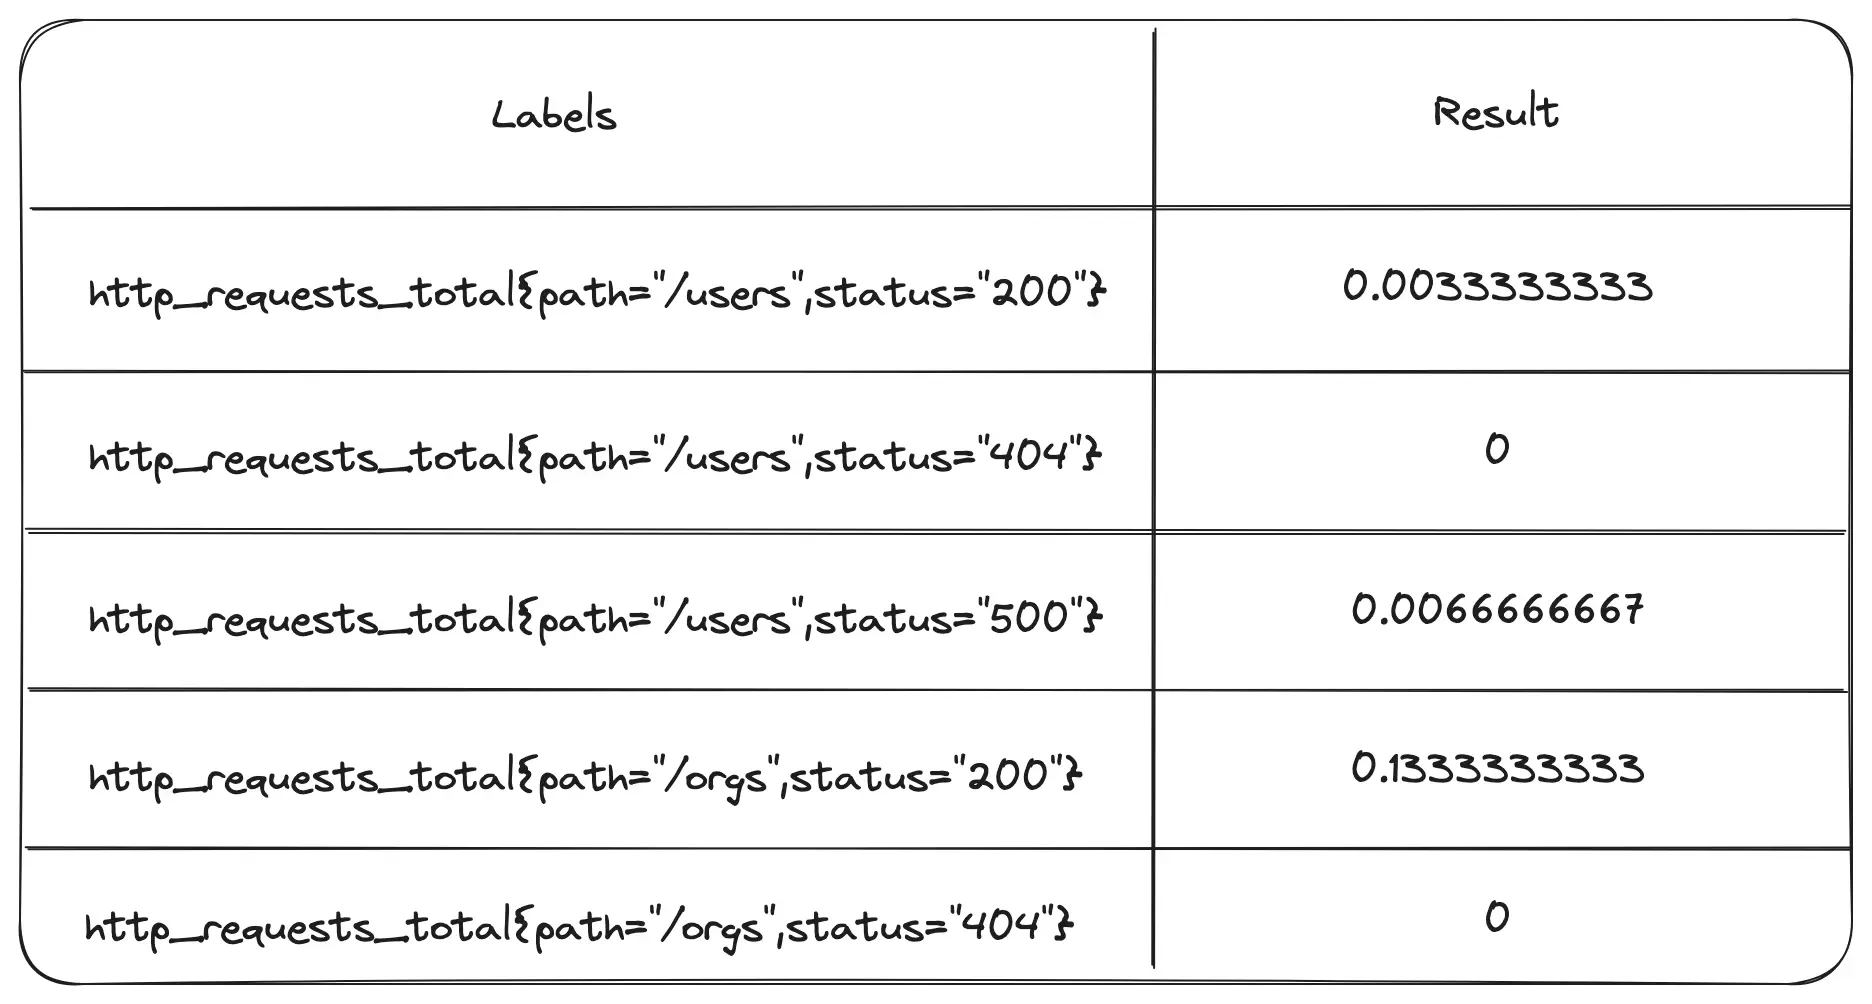
These numbers suddenly look a lot uglier, but that first value just means that a single event happened within the 5 minute window:

Now, if we graph this query as opposed to looking at the table view, each point on the graph will be the number of requests that were happening per second at the given point in time. And that’s closer to what we’d actually care to see.
The rate function also handles counter resets. So if your service crashes and Prometheus observes a counter go from 1000 to 5, it will calculate the rate using the fact that 5 events happened between those scrapes.
Label sets and why you’ll often need sum by
Before we continue building up our query, it is important to take a moment to understand Prometheus labels. Prometheus stores a separate time series for every unique combination of label values.
In our example table, we have the counter http_requests_total with the labels path and status. For each combination of path and status, we’re storing a counter value for every timestamp.
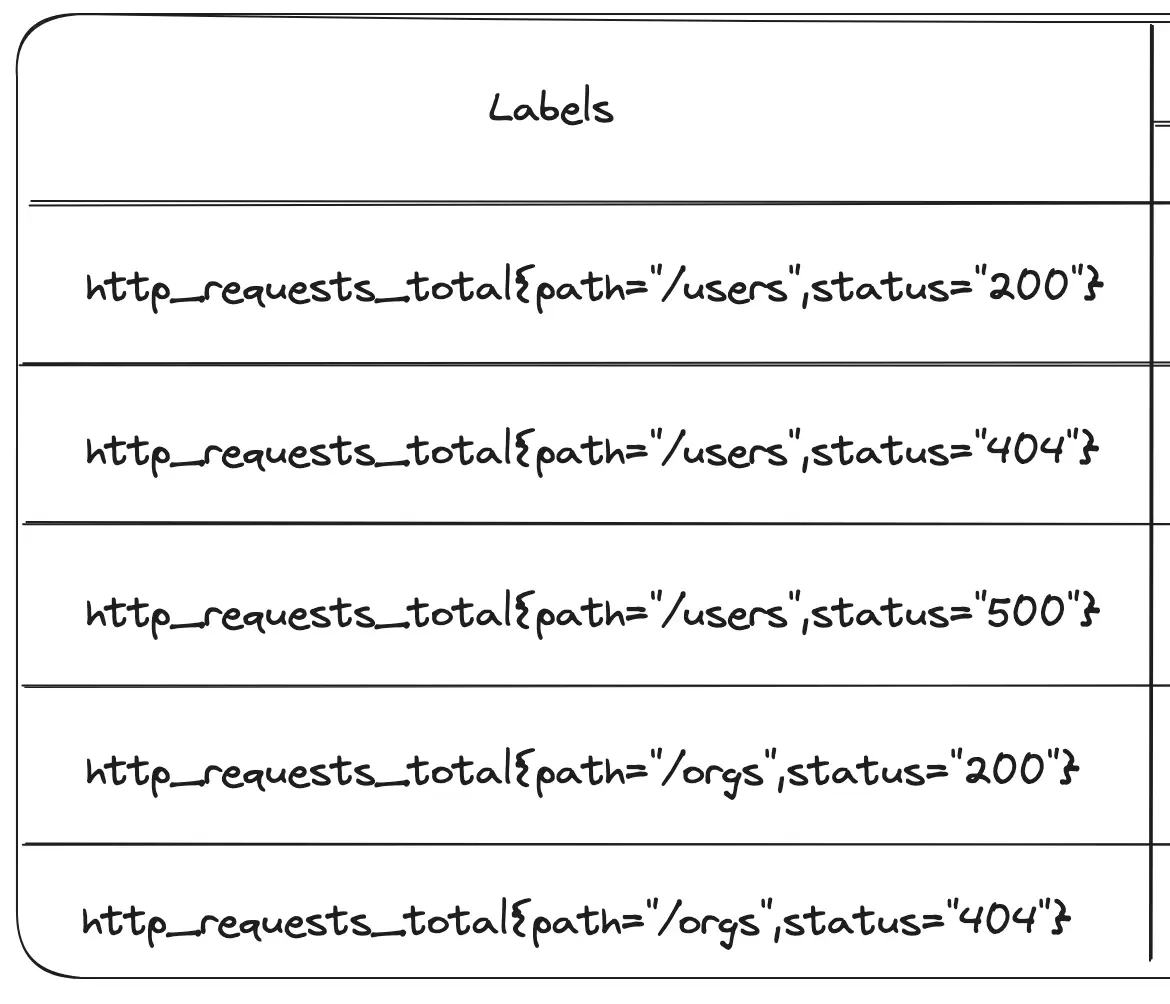
(This is also why people often talk about the “label cardinality problem” or “cardinality explosions”. Every new value you have for a given label requires storing a new time series. If you store a label that varies too much, such as a user ID, you’ll create way too many time series and blow up your Prometheus database.)
When querying our data, we often care about some of those label dimensions and not others. In PromQL, sum by (label1, label2,…) groups the time series by the labels you specify and uses the sum function to merge series together (similar to GROUP BY in SQL).
Going back to our example table, we only have two labels: path and status. If we wanted to look at the number of requests per second for each path, while ignoring the status, we would use the following query:
sum by (path) (rate(http_requests_total[5m]))In real Prometheus deployments, we often have quite a few more labels. For example, Prometheus automatically adds the job and instance labels to identify each unique target it’s scraping. However, we might not care about looking at the metrics separately for each instance of our service, so we’ll need to sum by using the labels we do care about and have Prometheus sum up the rest.
Finally, this brings us back to our original query. If we want to look at how many requests are being returned with different HTTP status codes, independent of the path, we can use this query and we would see the results that follow:
sum by (status) (rate(http_requests_total[5m]))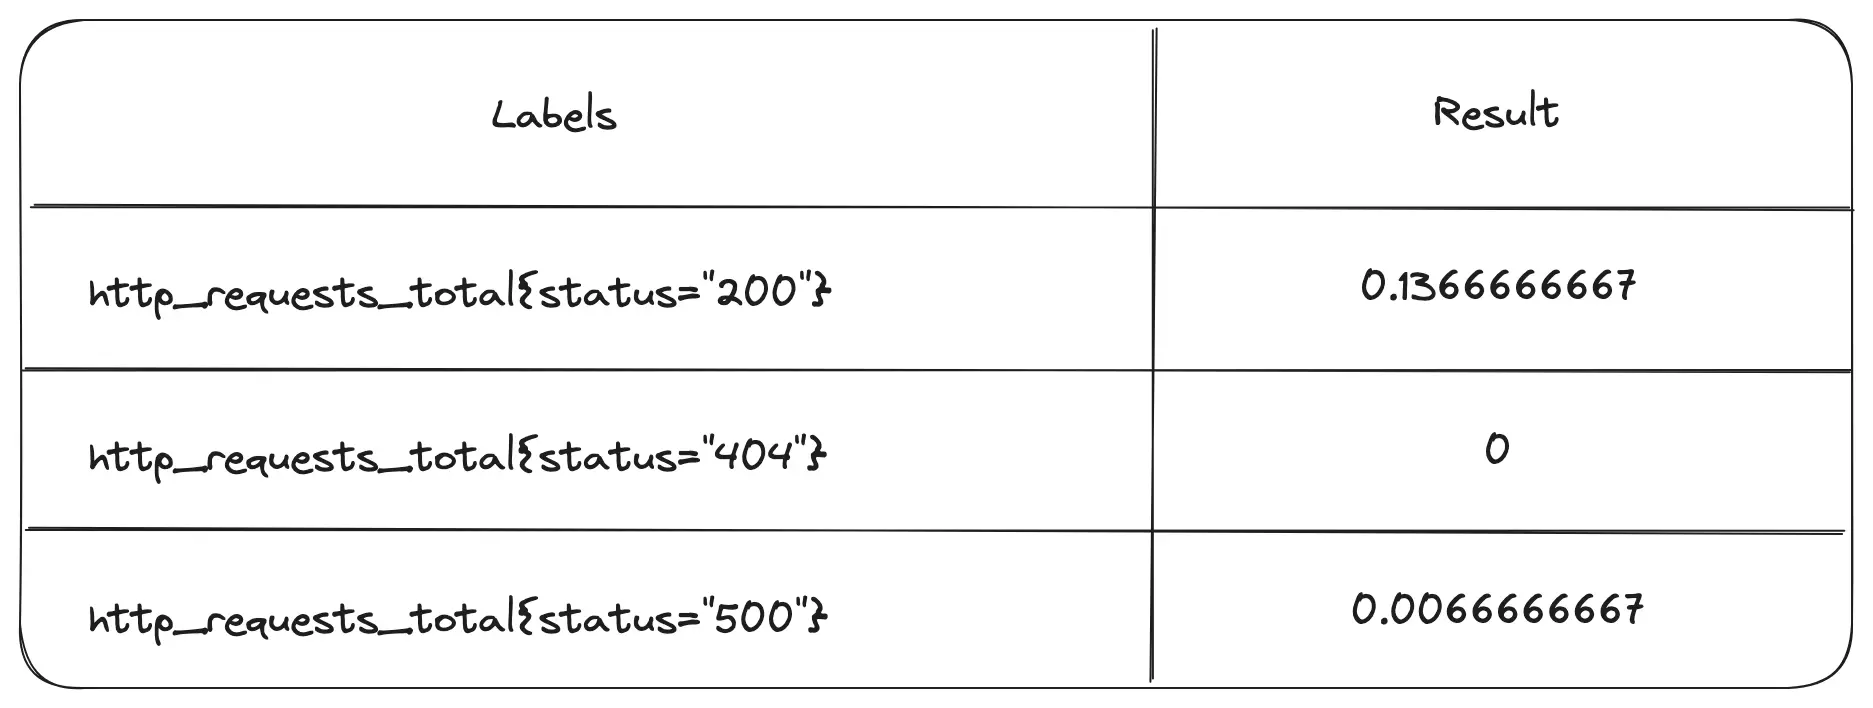
This sum by (labels) (rate(metric[5m])) construction is very useful, and a good one to keep in your back pocket.
Unfortunately, there are also a number of important issues to watch out for aside from things specifically related to PromQL.
Am I looking at the right data?
There are two more challenges that engineers often run into that don’t have anything to do with the query language itself.
First, what metrics should you use to answer a particular question? Organizations may have many thousands of metrics and, without experience, it’s hard to know what is available and what might be useful to investigate a particular type of issue. Pre-built dashboards and queries can help somewhat, though many organizations also struggle with the problem of having too many dashboards for people to know where to look.
The second and even more pernicious problem is the uncertainty around whether a query you’ve written shows you what you think it shows. You may have worked hard on a query and finally gotten the syntax right. But is it statistically correct? Fundamentally, Prometheus doesn’t know. These time series are just a bunch of numbers with string labels attached. Prometheus has no understanding of what different metrics mean and, as a result, can’t help you write a good query or tell you if the graph you end up looking at answers your actual question. This is especially dangerous because the wrong query can send you down a useless path while debugging an incident, or it might suggest a fix that won’t actually solve the problem.
Conclusion: PromQL queries are hard
Writing good queries requires knowledge of your system, an understanding of the query language syntax, and even some statistics. And in this post, we’ve only begun scratching the surface! All of this is difficult to pick up, and definitely not something you want to learn during a high-stress incident while your service is down and users are complaining. Queries are hard to write in any query language, and PromQL is no exception.
Autometrics writes PromQL so you don’t have to
We kept hearing engineers say that “queries are hard” while working on collaborative notebooks for DevOps and Site Reliability Engineers at Fiberplane. This is what motivated us to create the open source Autometrics project.
Autometrics builds on top of existing Prometheus and OpenTelemetry client libraries and makes it trivial to instrument functions in your code with the most useful metrics: request rate, error rate, and latency. It standardizes these metrics and then uses your function details to build powerful PromQL queries for you. This improves the experience of instrumenting your code and massively simplifies the process of identifying and debugging issues in production.
If you’re using Prometheus but don’t like manually writing queries, try adding it to one of your projects today! It’s available now for Rust, Go, Python, Typescript, and C#.
Get involved
If you’re interested in helping to improve the developer experience of Prometheus metrics and observability in general, come join the Autometrics project! The code and discussions are available on Github and you can come join the conversation on Discord.